Recently, the S&P Global Sustainability Yearbook [1] got published. During my KPMG days I used to look at the yearbook (it was the RobecoSAM Sustainability Yearbook then) and track how many of the Indian companies featured in the yearbook and of which how many were my clients. Almost 70-80% of the companies featured used to be my clients and a good number of the remaining names would be KPMG audit clients and we had restrictions offering advisory services to them. I am doing this analysis after a gap of an year and this time the entry of HCLTech to the yearbook prompted me.
By sharing this analysis, I am in no way endorsing that ESG/Sustainability ratings are a proxy for sustainable performance. But I firmly believe that the ratings help improve transparency and disclosures around ESG parameters.
There are 21 Indian companies that have featured in the S&P Global Sustainability Yearbook. Amongst the 710 companies worldwide that have featured in the yearbook, 2.96% are Indian companies. This is almost the same as Brazil, but much lower than Korea, Taiwan, and Thailand to name a few.
The 7 Indian companies that have featured in the top 10% S&P Global ESG Score are:
- Top 1% – Hindalco and Tech Mahindra
- Top 5% – Wipro and Hindustan Zinc
- Top 10% – Mahindra, Hindustan Unilever and Tata Steel
Biocon and HCL Technologies have featured as Industry Movers. The remaining 12 companies form a part of the Yearbook as they are in the top 15% of S&P Global ESG Score.
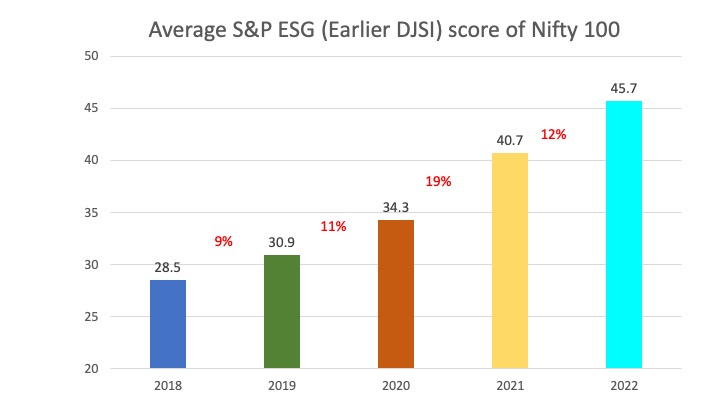
I also pulled out the S&P ESG Scores of the Nifty 100 companies[2] and did an analysis. The Nifty 100 companies over the last 5 years have improved the average ESG score by 60%. There is a steady improvement that can be observed during this period.
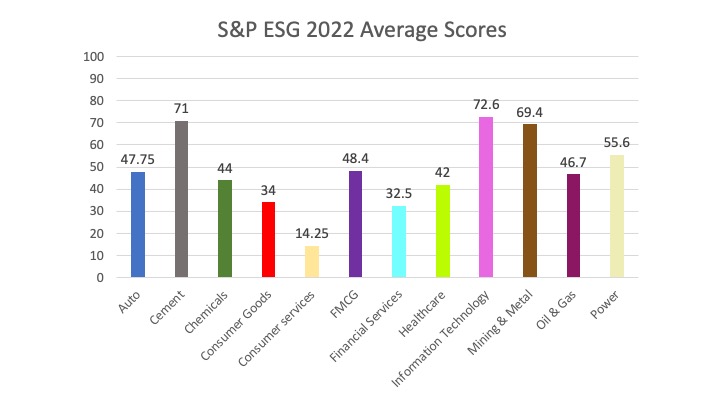
When we look at the sectors, we find that the average score of IT companies is the highest among all sectors, followed closely by the cement sector and mining and metals. However, we do observe that the consumer-oriented sectors have been featuring on the lower side of the spectrum. While international business exposure is a leading driver for IT companies, for cement and mining companies, the driver is the risk of being an extractive industry segment.
Compared to 2021, 64 companies improved their score in 2022. The maximum percentage-wise improvement was achieved by Colgate Palmolive (India) Ltd. It improved the score by 206%, albeit from a smaller base. If one considers a minimum score of 40 in 2021 and the improvement of score to 2022, HCL Technologies has recorded the maximum (35%). While 11 companies maintained the same score as of 2021, for the remaining 19 companies, the 2022 score was lesser than the 2021 scores.
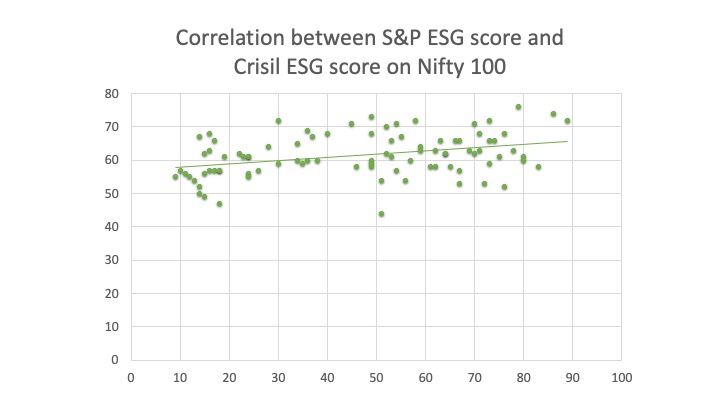
Crisil vs S&P ESG ScoresCrisil, which is an S&P Global Company, has scored 586 companies on ESG in India[3]. The methodology is different and as I understand it, Crisil considers the Indian context in the evaluation criteria. I felt it might be interesting to plot the Nifty 100 companies’ scores for both the ratings. The X axis in below chart is the S&P score and the Y axis is the Crisil score. It is evident that the variance of score for S&P ESG score is much higher than that of Crisil. While Crisil scores for the Nifty 100 range between 43 to 76, the S&P scores range between 9 to 89. There is only a moderate correlation between the data sets.
The variance of rating between the rating agencies has been a debate for a while now. This variance between the two data sets of S&P and Crisil being an S&P company is also testimony to the fact that the scores depend on the methodology and the objective of the rating. While the Crisil rating is more tuned towards the SEBI requirements for ESG rating providers, the S&P ESG scoring methodology continues to be an international framework. Both ratings find utility with some stakeholders. For a company, it is important to understand the differences between various rating agencies and decide which ones to focus on. The debate as to why the rating for a company is very different to another rating company is not relevant. It will be different, else across the world we would end up with only one ESG rating methodology. And it would become a monopoly practice.
Overall, it is heartening to know that the average ESG scores for Indian companies has been improving over the years. But the variance across sectors is also an indication that the drivers for some sectors in India are still lagging behind. I am sure the mandate of Business Responsibility and Sustainability Reporting (BRSR) will push the ESG scores of Indian companies further.
Note: Both S&P ESG score and Crisil ESG Scores were available for 94 companies on Nifty 100, hence all analysis is based on the same.
[2] https://www.spglobal.com/esg/solutions/data-intelligence-esg-scores
very nice
Hi santhoshjayaram.com admin, You always provide in-depth analysis and understanding.
Hi santhoshjayaram.com admin, You always provide clear explanations and definitions.